
Candlestick patterns are one of the most widely used tools in technical analysis. They help traders understand price action, identify potential reversals, and make more informed decisions in the market. Among them, bullish candlestick patterns are especially popular because they signal possible upward movement in price.
However, what many traders don’t realize is that these patterns do not behave the same way in every market condition. In highly volatile environments, especially during major news releases or around forex market open time, candlestick patterns can produce false signals, stronger breakouts, or faster reversals than expected.
Understanding how volatility changes the behavior of bullish candlestick patterns is essential for traders who want to avoid misinterpretation and improve timing in the forex market.
Here are 8 bullish candlestick patterns and how they behave differently in volatile conditions.
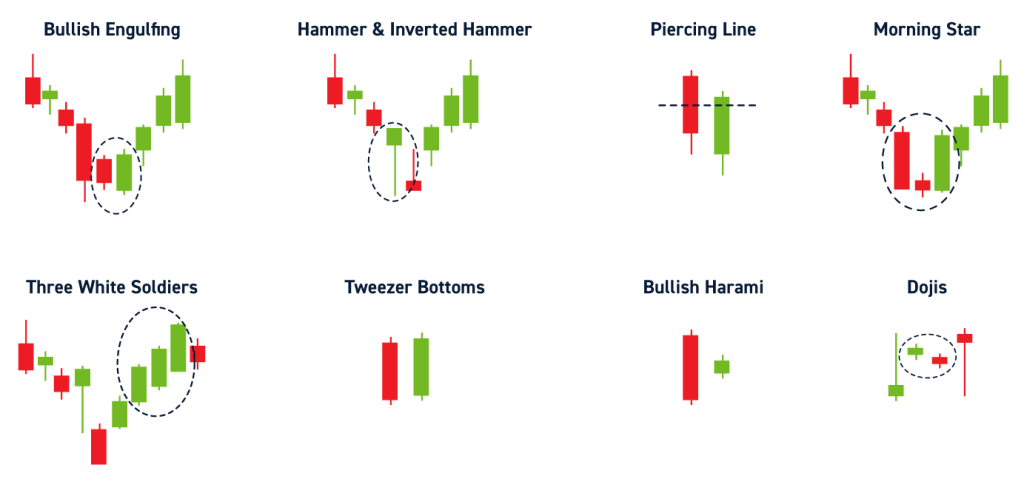
1. Bullish Engulfing Pattern
The bullish engulfing pattern is one of the strongest reversal signals in technical analysis. It occurs when a large bullish candle completely covers the previous bearish candle.
In normal conditions, this pattern often signals a steady trend reversal. However, during high volatility, especially near forex market open time, it can produce false breakouts. A strong initial surge may quickly reverse if institutional traders take profits or if liquidity is uneven.
Traders should wait for confirmation rather than entering immediately after the pattern appears.
2. Hammer Pattern
The hammer is a single-candle reversal pattern that forms after a downtrend, showing rejection of lower prices.
In volatile markets, hammers appear more frequently but are less reliable. Price swings create long wicks in both directions, which can make the pattern misleading. Around forex market open time, liquidity spikes can exaggerate wick formations, making it harder to distinguish real reversals from noise.
Confirmation from the next candle becomes even more important in these conditions.
3. Morning Star Pattern
The morning star is a three-candle pattern signaling a bullish reversal after a downtrend.
In stable markets, it forms gradually and provides a clear signal. But in volatile environments, the middle candle (doji or small body) can become distorted due to rapid price fluctuations. This can weaken the clarity of the pattern.
During early trading hours, especially around forex market open time, sudden volatility may cause incomplete or irregular formations, requiring traders to be more cautious.
4. Piercing Line Pattern
The piercing line pattern occurs when a bullish candle closes above the midpoint of the previous bearish candle.
In calm markets, it signals moderate bullish momentum. In volatile conditions, however, price may pierce deeply and then quickly reverse, reducing reliability.
High volatility in the forex market often causes exaggerated movements that can mislead traders into entering too early without proper confirmation.
5. Bullish Harami
The bullish harami is a smaller bullish candle contained within a larger bearish candle. It suggests potential weakening of downward momentum.
In volatile markets, this pattern becomes less reliable because large price swings can distort the size relationship between candles. Around forex market open time, rapid price fluctuations may create multiple false harami formations in a short period.
Traders often need additional indicators to confirm the signal before acting.
6. Three White Soldiers
The three white soldiers pattern consists of three consecutive bullish candles, indicating strong upward momentum.
In stable markets, it shows sustained buying pressure. However, in volatile conditions, especially after major news releases or at forex market open time, this pattern may appear too aggressively, followed by sharp pullbacks.
The speed of formation can sometimes indicate exhaustion rather than strength, which makes context extremely important.
7. Inverted Hammer
The inverted hammer forms after a downtrend and suggests a possible bullish reversal, but it requires confirmation.
In volatile markets, long upper wicks become more common due to rapid price spikes. This can create confusion between real buying pressure and temporary liquidity-driven moves.
At forex market open time, price gaps and sudden spikes may distort the pattern, making confirmation essential before entering a trade.
8. Bullish Doji Star
The bullish doji star represents market indecision followed by a potential reversal.
In low volatility conditions, it can be a reliable signal when combined with trend context. But in volatile markets, doji candles appear frequently due to constant price fluctuation, reducing their predictive value.
During active trading sessions or forex market open time, traders may see multiple dojis that do not lead to any meaningful reversal, making patience and confirmation critical.
Why Volatility Changes Everything
Volatility affects candlestick patterns because it reflects rapid shifts in supply and demand. When liquidity is unstable, price movements become less predictable, and candlestick shapes can be influenced by short-term spikes rather than sustained market sentiment.
This is especially true during forex market open time, when different global trading sessions overlap or transition. Institutional traders enter the market, spreads widen, and price action becomes more reactive.
As a result, bullish candlestick patterns may:
- Appear more frequently
- Produce false signals
- Reverse quickly after formation
- Require stronger confirmation
Final Thoughts
Bullish candlestick patterns remain powerful tools in technical analysis, but they are not foolproof. Their effectiveness changes depending on market conditions, especially during high volatility and active trading hours.
Understanding how patterns behave differently during forex market open time helps traders avoid false signals and improve decision-making. Instead of relying on patterns alone, successful traders combine candlestick analysis with volume, trend structure, and broader market context.
